

Since the Great Financial Crisis (GFC), the private credit market has grown from approximately $300 billion to over $1.2 trillion in size. In Part III of this blog series, we discuss different private credit sub-asset classes and review their merits and risks. We also examine how private credit fits within a well-diversified portfolio.
Private credit spans across different sub-asset types, collateral, and positions along a company’s capital structure. Below are a few different sub-sets:
As explained in the first blogpost, The Private Credit Opportunity: Part I, direct lending refers to the private financing of middle market companies for mergers & acquisitions (M&A), leveraged buyouts (LBOs), and recapitalizations. The borrower is typically a private equity (“PE”) sponsor-backed company, but can also be a non-sponsored or family-owned business. Direct lending is cash flow-based financing, meaning loans are originated for an amount based on a multiple of a company’s underlying earnings (EBITDA) and cash flows.
Direct lending strategy types are delineated by the amount of earnings a company generates. Below are key characteristics of each sub-set:
Lower Middle Market Lending
Managers who implement lower middle market strategies originate and lend to companies that have between $5-25MM in EBITDA. While the space is more competitive today, loans historically have more covenants and structural protections relative to those made to larger companies. Relative to larger companies, businesses are more susceptible to economic downturns and may have less-sophisticated management teams. Additional structural protections in underlying loans help offset these additional risks.
Traditional (Core) Middle Market Lending
Managers who implement traditional middle market strategies originate and lend to companies between $25-50MM in EBITDA. Competition in the space is also high as managers who lend to lower and upper middle markets also finance traditional middle market companies. In general, one can expect less covenant protections relative to lower middle market companies given the level of competition.
Upper Middle Market Lending
Managers who implement upper middle market strategies originate and lend to companies with $75MM or more in EBITDA. Competition is high, but only a select few lenders have the ability to originate loan amounts necessary to meet the financing needs of large companies. Moreover, upper middle market direct lenders have taken more market share from the public broadly syndicated loan market over the last several years. Reasons for the shift include the managers’ speed of execution, certainty of close, and the ability to create customized solutions. As shown in Exhibit A, growth in $1 billion+ deals has greatly expanded.
Exhibit A: Growth in Upper Middle Market Deal Size
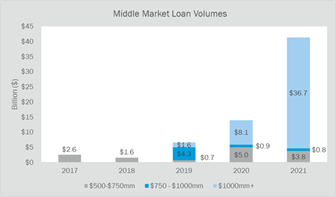
Source: Owl Rock, Fitch Research. As of 2/28/2022
Asset-based lending refers to financing backed by the underlying asset value(s) of a company. Assets used as collateral include accounts receivables, inventory, and real estate. Loan terms are set based on the liquidation value of the asset in question and are constantly assessed throughout the life of the loan. Asset-based loans are generally tied to consumer-based and capital-intensive businesses.
Capital solutions is a form of opportunistic lending that provides rescue or transitional capital to companies that need short-term financing. Loans can either be cash flow-based or asset-based and are highly customized. Many credit-oriented hedge funds participate in providing these types of loans given their expertise in underwriting unique capital structures. Expected returns are typically higher relative to traditional direct lending due to the level of complexity. The ability for capital solution strategies to take advantage of market dislocations provides potential diversification in a broad-based private credit portfolio.
Specialty lending is a broad category that offers financing to companies that cannot access traditional sources of capital. Companies may have complex capital structures or unique revenue streams that do not fit neatly in a “conveyor belt” direct lending platform. Specialty lending may include both cash flow-based or asset-based lending and are usually highly customized.
Structured credit refers to the pooling of various loan types and securitizing them into separate priority-ranked and cash flow-based tranches. Mortgage-backed securities (MBS) and collateralized loan obligations (CLOs) are examples of structured credit. Underlying loans may be public or private and liquidity may differ depending on the underlying collateral.
Exhibit B: Sub-Asset Class Overview
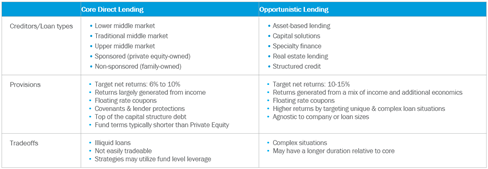
Source: Canterbury
Private credit has the potential to improve portfolio risk-adjusted returns with lower correlation to other asset classes. Over a five-year period, private credit (as demonstrated through the Cliffwater Direct Lending Index) has provided better risk-adjusted returns and lower correlation to other public asset classes.
Exhibit C: Return to Risk, 5 Year Trailing Exhibit D: Private Credit Correlation
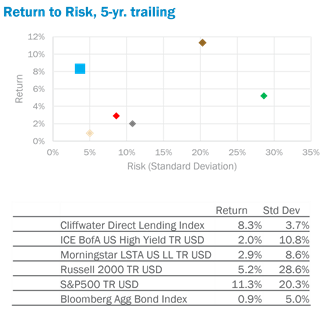
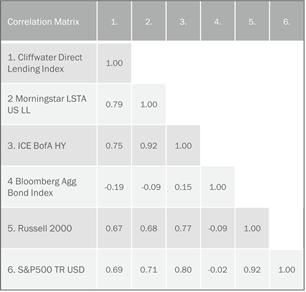
Source: Morningstar Direct, Cliffwater. Source: Morningstar Direct, Cliffwater.
As of 6/30/2022 Correlation from 10/2004 through 6/2022
Notably, private credit has lower correlation to public credit, including leveraged loans and high yield bonds. Private credit’s loan differentiation and low liquidity profile are likely reasons for the correlation to core fixed income.
Private credit may warrant a dedicated allocation in a diversified portfolio given the asset class’s unique characteristics. Historically low defaults, high recovery rates, and floating rate coupons are key attributes that offer diversification from other major asset classes.
Disclosures:
This presentation and any other material has been prepared solely for informational purposes and shall not constitute an offer to sell or the solicitation of an offer to buy any security or to participate in any investment managed by or associated with Canterbury. The information presented is for illustrative purposes only and does not constitute an exhaustive explanation of the investment process, investment strategies or risk management. Benchmarks and indices are presented herein for illustrative and comparative purposes only. The Cliffwater Direct Lending Index tracks the performance of a basket of public loans that make up the underlying investments in publicly traded Business Development Companies (“BDC”s). The public securities equity and fixed income indexes shown are composed of the publicly traded securities in the respective market segment. Such benchmarks and indices may or may not be available for direct investment, may be unmanaged, assume reinvestment of income, do not reflect the impact of any trading commissions and costs, management or performance fees and have limitations when used for comparison or other purposes. They, among other things, may have different strategies, volatility, credit or other material characteristics (such as the use of leverage, the inclusion of number and types of securities and instruments). Canterbury believes that the information contained herein is accurate and/or derived from sources which are reliable, but Canterbury does not warrant its accuracy or completeness. Canterbury has no obligation (express or implied) to update any or all of the information contained herein or to advise you of any changes. The returns information contained herein is as of the date indicated next to each graphic illustration. Future returns may be higher or lower than the results portrayed in this presentation. PAST PERFORMANCE IS NOT INDICATIVE OF FUTURE RESULTS, WHICH COULD VARY SUBSTANTIALLY. Any references to present or past performance have been provided for illustrative purposes only. It should not be assumed that the strategies represented by these indexes were or will be profitable or that any future investments by Canterbury will be profitable or will equal the performance of the indexes shown.
Mr. Asmus is a shareholder and part of Canterbury’s Research Group. He is responsible for the sourcing, due diligence, and monitoring of public market investment managers. He serves as chair of Canterbury’s ESG, Fixed Income, and Real Assets Manager Research Committees, and vice chair of the Hedge Funds Committee. He also sits on the Capital Markets Committee. Mr. Asmus joined Canterbury in 2013 as an analyst serving institutional and taxable clients. Prior to Canterbury, Mr. Asmus was an institutional fixed income representative for Mutual Securities, LLC, where he provided fixed income solutions for county and city municipalities. Mr. Asmus graduated with a Bachelor of Arts from California State University, Fullerton, where he double majored in business administration, finance, and music performance, jazz studies. He is a CFA® charterholder and a Chartered Alternative Investment Analyst.