
The private credit asset class has grown immensely since the Great Financial Crisis (GFC). In Part II of this blog series, we discuss private credit performance and volatility relative to public credit. We also examine private credit relative to other private capital sub-asset classes.
Over the last decade, private credit has generated higher returns relative to public credit. Using direct lending as a proxy for private credit, Exhibit A compares the Cliffwater Direct Lending Index to the BofAML U.S. High Yield and S&P LSTA Leveraged Loan Indices.
Private & Public Credit Trailing Returns

Exhibit A. Source: Cliffwater, Morningstar Direct. As of March 31, 2022
Since 2001, investing in private credit produced a much higher compounded return relative to public credit. While higher coupons and additional economics contributed to the outperformance, the use of leverage also enhanced returns. Exhibit B uses actual private credit returns from prior fund vintages compared to a blended public credit proxy of leveraged loans and high yield bonds. The ‘Global Private Debt’ return stream from Pitchbook includes direct lending, credit special situations, bridge financing, real estate debt, infrastructure debt, and venture debt.
Private & Public Credit Investment Growth

Exhibit B. Source: Pitchbook, Morningstar Direct. As of March 31, 2022
Given the outperformance, is private credit riskier than public credit? The answer is yes and no. While direct lending and other private credit loans are not evaluated by official credit rating agencies, the underlying credit worthiness of a company utilizing the private debt market is usually synonymous to that of traditional below-investment grade issuer. Private loans are typically 1st lien (i.e. top of the capital structure) and have more stringent protections and covenants attached.
In contrast, most leveraged loans issued today have loose protections, otherwise known as cov-lite. High yield bonds are unsecured (i.e. no protections) and are subordinate to leveraged loans in company capital structures.
The lack of liquidity is a risky aspect of private loans. Loans are non-traded and are usually held by an asset manager until maturity. As a result, there is no active market to buy and sell private loans. Private loans are also more bespoke and have more nuanced structural difference relative to public credit. Investors should expect to receive liquidity and complexity premiums when investing in private credit in-lieu of public credit. Depending on the type of strategy, excess returns range from 200-600 basis points as seen in Exhibit A.
Since mid-2000’s, private credit has generated approximately 1/3rd less volatility with a fraction of the drawdown relative to public credit (using direct lending as a proxy).
Private & Public Credit Return & Volatility (Since Inception, %)

Exhibit C. Source: Cliffwater, Morningstar Direct. From October 2004 - March 2022
The lower volatility profile is a result of the reasons mentioned earlier (i.e. top of the capital structure, stringent covenants), but is also influenced by the lack of liquidity. Leveraged loans and high yield bonds are marked-to-market daily whereas private loans are not. Illiquid investments are valued less frequently (i.e. quarterly, annually) and may be subject to smoothing effects, where volatility is potentially understated. Since private loans are usually marked on a quarterly basis under different methodologies, the bias to use historical valuations may result in unintended smoothing.
However, the smoothed effect for private credit is small relative to most other illiquid asset classes. The Cliffwater Direct Lending Index (CDLI) prior quarter return explains only 8% of the index’s current quarter return. The unsmoothed volatility adjustment for the CDLI is 4.5%, which is roughly ½ less than that of the blended public credit index (shown in Exhibit C).
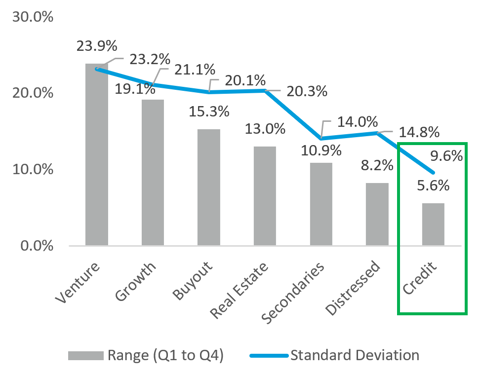
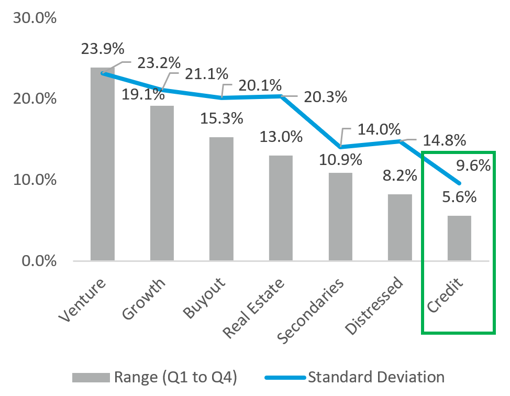
Private credit 9as represented across all sub-asset types per Pitchbook) has demonstrated lower volatility and a tighter return dispersion relative to other private capital asset classes, including venture capital, growth equity, buyout, real estate, Secondaries, and distressed.
Private Capital Dispersion of Returns

Exhibit D. Source: Pitchbook, aggregated vintages from 2002-2017, updated as of March 2022
Private Capital Net IRRs
Exhibit E. Source: Pitchbook, aggregated vintages from 2002-2017, updated as of March 2022
Exhibit D shows the range of dispersion between first and fourth quartile private capital managers and the aggregated standard deviation for the given sub-sector. Private credit’s range of net IRR outcomes (5.6%) is much tighter compared to the other asset classes. Private credit’s standard deviation is also much lower (9.6%), as would be expected given the asset class’s income orientation and ‘top of the capital structure’ position.
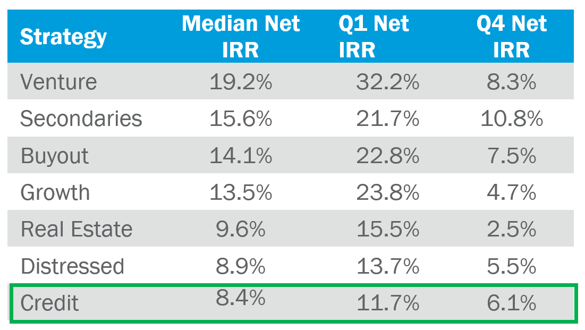
Private credit’s aggregated median net IRR is 8.4% (Exhibit E). While the return is lower relative to others private capital sectors, private credit generated competitive performance with a fraction of the volatility.
In Part III of the private credit blog series, we will discuss different private credit sub-asset classes and review the merits and risks of various strategies. We will also examine how private credit fits within a well-diversified portfolio.
Sources