

While inflation has moderated, the Consumer Price Index (CPI) remains above the Federal Reserve’s (the Fed’s) 2% target. The Fed continues to signal a restrictive policy stance and has maintained the Fed Funds rate above 5% longer than the market initially anticipated. Meanwhile, the U.S. Treasury continues to issue new debt to fund financial obligations and bridge the fiscal deficit. Despite this, the Fed and the Treasury have implemented measures to support market liquidity in a restrictive environment. In this blog post, we will explore these measures and their implications.
Higher for Longer
At the end of 2023, the Fed expressed concern about prolonged high interest rates. This “dovish” pivot resulted in the market pricing in six 25 basis point rate cuts in 2024. However, over the last five months, positive economic growth and persistent inflation has prompted the Fed to reconsider. As of early June 2024, the market now anticipates approximately one and a half rate cuts. FOMC members continue to reiterate a restrictive monetary policy and the ability to sustain higher interest rates for an extended period.
Interest Rate Path Probabilities - Fed Futures
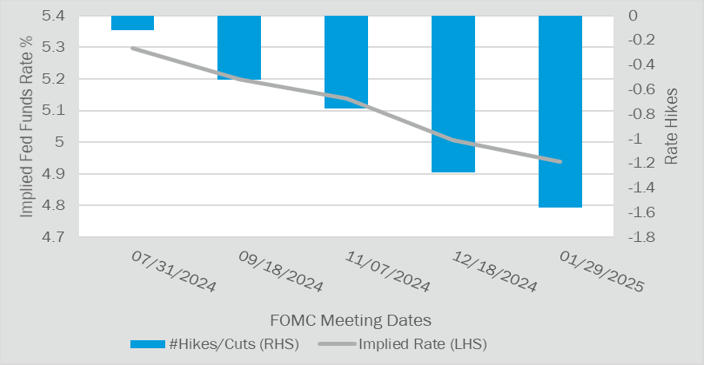
Figure 1. Source: Bloomberg as of 5/29/2024
Treasury Issuance Bonanza
Year-to-date[1], the United States Treasury has issued a net $530 billion in treasury bills, notes, and bonds[2]. Since the debt ceiling crisis in 2023, the Treasury has consistently borrowed to replenish the Treasury General Account (TGA) and to meet federal obligations. The TGA acts as the U.S. Government's "checking account," where all revenues are collected, and expenses are paid. By the end of May 2024, the TGA grew to approximately $700 billion after bottoming in June 2023. Increasing the TGA creates a mixed effect. While selling treasury securities to fund the account withdraws market liquidity, increased government spending can stimulate growth and potentially lead to further inflation.
Treasury General Account Balance (week avg.)
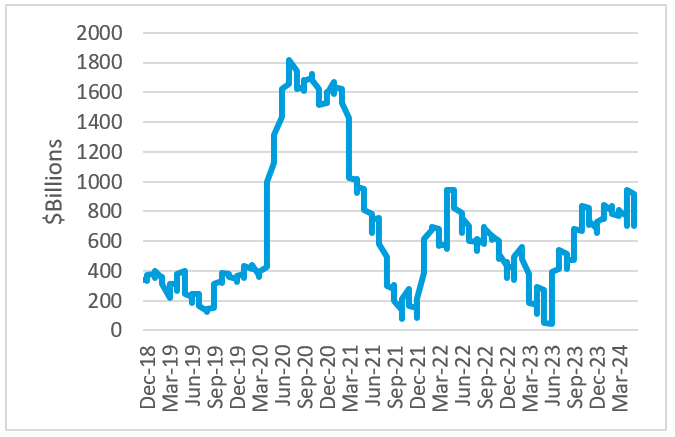
Figure 2. Source: St. Louis Fed as of 5/29/2024
Farewell to Excess Liquidity
During the same period, the Fed’s Reverse Repo Facility (RRP) has moved in the opposite direction of the TGA.
Reverse Repo Facility (RRP)
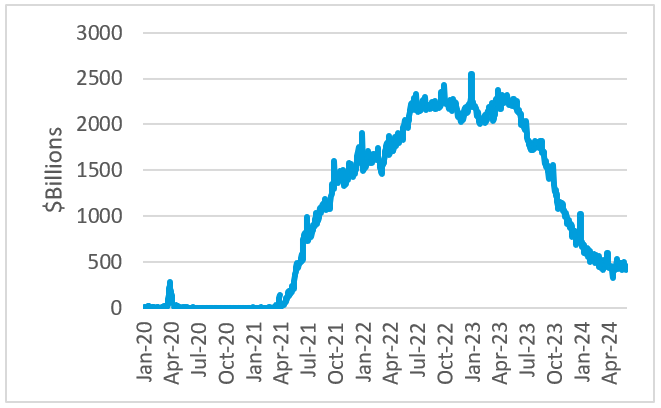
Figure 3. Source: FRED St. Louis Fed as of 5/31/2024
A reverse repo (RRP) is a transaction in which the Fed removes reserves from the banking system by selling government securities to financial institutions with an agreement to repurchase them at a higher price at a future date.
The RRP peaked at approximately $2.5 trillion in late 2022 as the facility absorbed excess market liquidity from prior COVID-19 stimulus measures. As the U.S. Treasury began issuing debt in the summer of 2023, excess liquidity via RRP declined to accommodate the new supply of treasury bonds entering circulation. Moreover, the Fed’s balance sheet reduction, with bond roll-offs (i.e., maturing) amounting to $95 billion per month, contributed to the decline in the RRP. The facility fell to $440 billion by the end of May 2024.
With excess liquidity diminishing and treasury issuance expanding, both the Fed and the Treasury have recently implemented changes to “accommodate” the tightening effects.
Balance Sheet Reduction
In May 2024, the Fed announced that they would reduce the monthly roll-off of Treasuries from $60 billion to $25 billion while retaining the roll-off of mortgage-backed securities (MBS) at $35 billion[3]. The gradual pace of balance sheet roll-offs introduces a more expansive liquidity environment. Although the target level for the Fed’s balance sheet remains unknown, the decision to slow the pace of bond maturities will keep the balance sheet well above the pre-pandemic level of $4.2 trillion.
Federal Reserve Balance Sheet
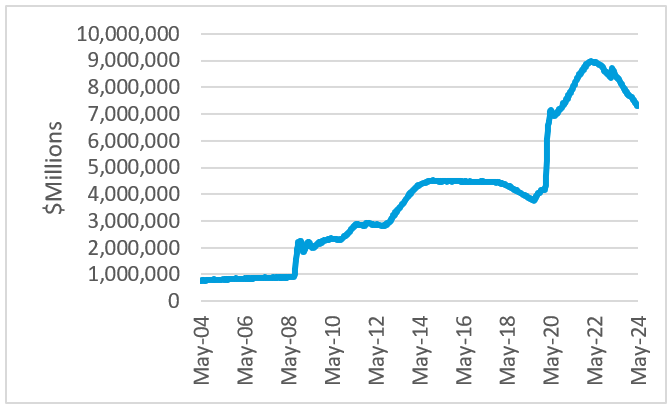
Figure 4. Source: FRED St. Louis Fed as of 5/29/2024
Treasury Buybacks
U.S. Treasury announced the start of a treasury buyback program on May 29th with the aim of preserving market liquidity standards. The initiative grants primary dealers the ability to sell more illiquid, off-the-run treasury securities back to the Treasury, facilitating more efficient clearing of new treasury security issuance in the future. Even though they are considered risk-free, off-the-run treasuries offer market participants sub-par collateral due to their low coupons, depressed prices, and heightened volatility when compared to new on-the-run equivalents. As a result, the buyback program injects additional liquidity into the financial system by removing these securities from dealer inventories. While the Treasury is effectively repurchasing its debt at a discount in the short-term, the long-term ramifications such as higher interest expense and a worsening fiscal outlook must be recognized, especially since the buybacks are funded with new treasury issuance.
Conclusion
Robust economic growth, low unemployment rates, and persistent inflation have prompted the continuation of restrictive policies and quantitative tightening (QT) by the Fed. Despite this, both the Fed and Treasury have introduced liquidity-softening measures that may counteract the restrictive interest rate regime imposed since 2022. While these measures may improve liquidity conditions in the short run, it is important to acknowledge the potential long-term consequences of persistently expansive policies, particularly in an era of perpetual fiscal deficits.
Sources:
[1] Source: 1/1/2024 - 4/30/2024
[2] Source: SIFMA
[3] Source: Board of Governors of the Federal Reserve System
Disclosures
Canterbury believes that the information contained herein is accurate and/or derived from sources which are reliable, but Canterbury does not warrant its accuracy or completeness. Canterbury has no obligation (express or implied) to update any or all the information contained herein or to advise you of any changes. The drivers of fiscal and monetary policies as well as its effect on economic conditions are complex. The blogpost does not aim to provide accurate or complete description of its dynamics. To the extent any information herein constitutes "forward-looking statements" (which can be identified by the use of forward-looking terminology such as "may", "will", "should", "expect", "anticipate", "upside", "potential", "project", "estimate", "intend", "continue", "target", "pending" or "believe" or comparable terminology), please note that, due to various risks and uncertainties, actual events, results or performance may differ materially from those reflected or contemplated in such forward-looking statements. Any forward-looking statements are for illustrative purposes only and are not to be relied upon as predictive of any specific economic or financial outcome.
Mr. Asmus is a shareholder and part of Canterbury’s Research Group. He is responsible for the sourcing, due diligence, and monitoring of public market investment managers. He serves as chair of Canterbury’s ESG, Fixed Income, and Real Assets Manager Research Committees, and vice chair of the Hedge Funds Committee. He also sits on the Capital Markets Committee. Mr. Asmus joined Canterbury in 2013 as an analyst serving institutional and taxable clients. Prior to Canterbury, Mr. Asmus was an institutional fixed income representative for Mutual Securities, LLC, where he provided fixed income solutions for county and city municipalities. Mr. Asmus graduated with a Bachelor of Arts from California State University, Fullerton, where he double majored in business administration, finance, and music performance, jazz studies. He is a CFA® charterholder and a Chartered Alternative Investment Analyst.