
On November 4, 2019, the S&P 500 closed at an all-time high of 3,078.27. It has been over a decade since the market crash of 2008. Since then, the index has climbed higher and higher, overcoming a wall of worries along the way. Invariably, investors are wondering whether to continue riding the bull, or to step aside before a potential crash.
The S&P 500 is a capitalization-weighted index, meaning that it holds companies in proportion to their market values. For the past decade, some of the largest companies in the index (highlighted in our article: FANGMAN, Revisited) have disrupted industries and become dominant players in their markets. As these large stocks have appreciated more than their peers have grown even larger in market capitalization, the index has benefited as well, gaining 15% per year from 2009 to 2019.
Does the length of this recent bull market mean that the market is “due” for a pullback? Not necessarily. According to a HCWE & Co. study from 2018 cited by The Wall Street Journal, there is no linkage between the length of a bull market and its remaining longevity in the 14 bull markets between 1925 and 2018. As the saying goes, “Bull markets do not die of old age.”
If the length of a bull market is not predictive, is there another reliable measure? Both history and logic suggest that market valuations should point us in the right direction. Unfortunately, there is no reliable way to predict markets in the short term (or else yours truly would’ve retired before writing this article!). However, in the long-term, if markets are cheap, future returns can be generally expected to be higher, and vice versa.
A commonly used measure of valuation is the Cyclically Adjusted Price to Earnings (CAPE) Ratio, otherwise known as the Shiller PE. This is a measure of valuation that uses real earnings per share over a 10-year period in order to smooth out business cycle fluctuations. Historically, a high CAPE Ratio portends lower subsequent 10-year returns, because it indicates that companies are expensively priced relative to their earnings. As of November 5, 2019, the CAPE Ratio on the S&P 500 was approximately 30.4, significantly higher than its historical average of around 16.9.
Shiller PE Ratio
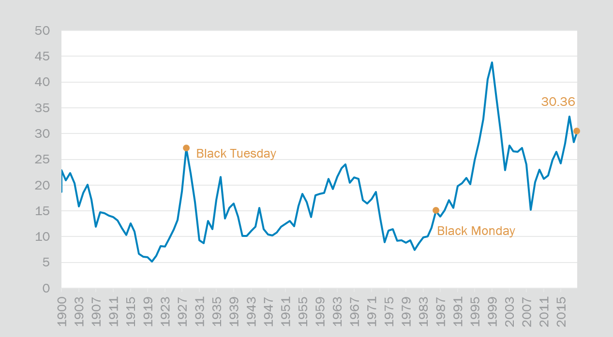
Exhibit A. Source: multpl.com/shiller-pe
This suggests that “irrational exuberance” could harm investors who expect the S&P 500 to continue on its blistering pace. The more likely scenario is for the index to return closer to its historical annualized gain of around 10% — or perhaps even less, based on its current valuation. Investors must be cognizant of the possibility of lower returns, rather than assuming that past performance is indicative of future results.
While it is not necessarily the time for fear, there are some prudent steps investors can take while investing in the S&P 500 at or near all-time highs. First, it may be wise to scale back on the S&P 500 if that investment has grown to be too large in proportion to other investments in one’s portfolio (known as “rebalancing”) over time. Other asset classes, such as emerging markets equities, have not done as well in this past decade, but may be poised to offer outperformance in the future because of their lower valuation.
Another consideration for taxable investors in the S&P 500 is to utilize a tax-managed separate account strategy rather than investing in a mutual fund. This type of strategy tracks the S&P 500 Index, but harvests tax losses throughout the year in order to generate “tax alpha,” or savings on taxes. While there may be slightly higher fees associated with such a strategy, the benefits in the form of tax alpha generally outweigh these costs for taxable investors.
Finally, investing in an alternative index that weights securities by fundamental measures rather than market capitalization can grant exposure to the stock market while reducing linkage to the most popular and highly valued stocks in the S&P 500. An example of this is an index which weights securities based on measures including cash flows, dividends, and book value rather than size.
With the S&P 500 near all-time highs, we remain cautiously optimistic and recommend that investors focus on what they can control, such as rebalancing, taxes, and considering alternative indexes. In other words, stay on the roller coaster — but fasten your seat belt!