
The Bloomberg Barclays U.S. Aggregate Bond Index, commonly referred to as the “U.S. Agg,” is one of the most popular fixed income benchmarks used to compare against bond portfolios. The index went through a number of evolutions before officially being called the U.S. Aggregate Bond Index in 1986. It was named the Lehman Aggregate Bond Index, then the Barclays Capital Aggregate Bond Index before it was given its current named — the Bloomberg Barclays U.S. Aggregate Bond Index. The U.S. Agg broadly tracks the U.S. investment grade bond market, which is composed of U.S. Treasurys, corporate bonds, mortgage-backed securities (MBS), and other securitized products.
In addition to the name changes over time, the U.S. Agg’s portfolio characteristics have also changed. One change is the index’s corporate credit exposure. Corporate credit exposure in the index has greatly increased over the past decade, meaning that credit risk has also increased (Exhibit A). To further illustrate with Exhibit B, the index’s BBB credit rating exposure has increased while AAA credit rating exposure has decreased over the same time frame, showing that the index is now comprised of more credit risk.
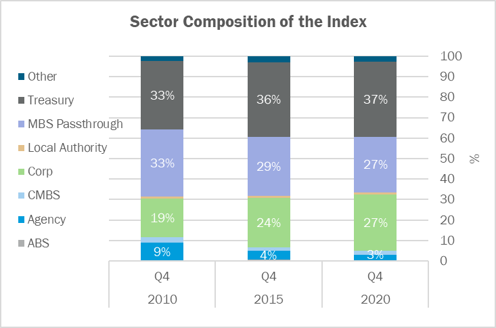
Exhibit A. Source: Bloomberg as of December 31, 2020
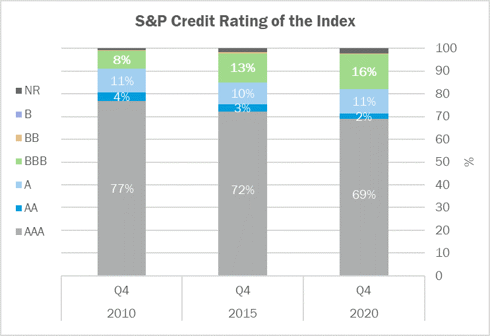
Exhibit B. Source: Bloomberg as of December 31, 2020. Treasurys and Agency MBS are categorized as AAA.
In addition to portfolio changes, the U.S. Agg’s yield-to-worst is the lowest it has ever been while its effective duration is the highest it has ever been (Exhibit C). Together, this shows that the index has more interest rate risk (measured by duration) and less expected return (shown by yield) relative to historical periods. One can argue that investors are not being compensated enough to take on extra interest rate risk.
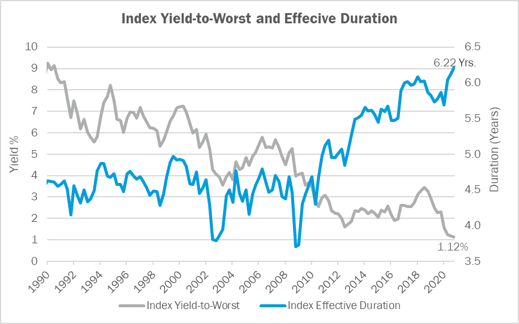
Exhibit C. Source: Bloomberg as of December 31, 2020.
Over the past decade, the bond market has increased by more than $10 trillion, which was driven by record Treasury and corporate bond issuance. Bond maturities have also increased, given new issuance from refinancing and extending debt maturities, also referred to as “terming out.” This helps explain why the Bloomberg Barclays U.S. Aggregate Bond Index has seen changes to its characteristics — as the index aims to represent the aggregate bond market.
Fed intervention in the bond markets has been the largest driver of low interest rates and low expected returns since the Great Financial Crisis (GFC). The central bank has not only lowered short-term interest rates to help reduce borrowing costs in light of the COVID-19 pandemic, but also purchased corporate bonds and provided various liquidity and credit facilities. With the Fed essentially backstopping the corporate bond market, investor confidence was renewed, which led to tighter credit spreads and lower yields as 2020 progressed.
Investors who need liquid bond exposure may want to consider allocating to an actively managed fixed income fund versus a passively managed fund. An active manager can shift exposures to manage interest rate risk, credit risk, and total return opportunities, which are perhaps more important than ever given the developments noted above over the past decade. Additionally, given low yields and persistent risks from interest rates and credit in liquid fixed income, it may be prudent for investors to think more holistically about fixed income exposures and consider the inclusion of private credit. We will discuss the merits and consideration of private credit in a separate post.