

The j-curve has been a familiar concept for private equity investors and textbooks for decades, as it has been understood that fund performance will be materially negative for several years before eventually turning positive. This blog post seeks to address whether the relevance of the j-curve is outdated in the context of modern private equity funds.
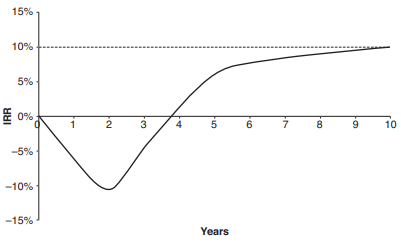
The j-curve can be defined as the “graphical representation of private equity returns, where initial losses cause a dip, followed by a reversal as the firm realizes gains on its investments.”[1] Essentially, the early years of a fund involve calling capital for investments, management fees, and organizational expenses, while the portfolio companies are still held at cost, resulting in a negative internal rate of return (“IRR”) and a total value to paid in (“TVPI”) below 1.0x. After several years, when value-add initiatives have been implemented, the market values of portfolio companies increase, and the fund's net return turns steadily positive until reaching its ultimate return several years later. According to Chartered Alternative Investment Analyst (CAIA), the negative period of the j-curve is expected to last approximately five years.
Canterbury notes that, due in large part to factors discussed in this post, the IRR does not always continually increase until the end of the fund’s life as depicted in the graph below. In many cases, the highest IRR is achieved during the interim years of a fund, before decreasing and ultimately flattening.
Median Vintage Year Returns by Strategy
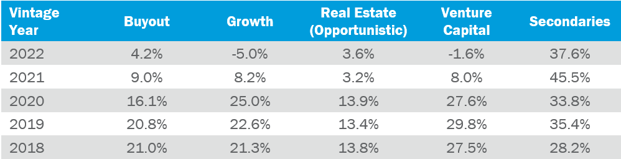
The table above depicts the median performance of various private equity strategies across the five most recent vintage years, the time period that one would historically expect performance to be meaningfully negative due to the factors listed above. The data clearly paints a very different picture, as the median performance across all strategies is already positive for 2021 funds, and only slightly negative for two strategies for 2022 funds (growth equity and venture capital).
It should be noted that investments in secondary funds have historically been viewed as a way to flatten or reduce the j-curve. This is due to the nature of the strategy, where positions are typically purchased at a discount and then immediately “written up” to fair value. With that said, due to the factors discussed below, particularly with regards to credit lines, the extent of early positive performance has become more significant.
There have been a number of causes for the reduction or elimination of the j-curve over the last number of years, including the following:
1. Prevalence of Credit Lines
As explored in a previous blog post, lines of credit have become much more prevalent in recent years and can have a profound impact on net IRR, particularly during the early stages of a fund’s life. In most cases, private equity funds now only call capital one to two times per year, thus delaying the pace of cash outflows from limited partners. The deferment of early capital calls mitigates the impact of the j-curve and decreases the amount of time required for a fund to generate positive returns.
2. Faster Deployment Pace
Private equity funds have been deploying capital at a faster pace in recent years. The average time between successive funds is now 2.8 years, significantly below the 10-year average ending 2020 of 4.1 years[4]. The faster deployment pace results in a higher number of investments within the first few years of a fund’s life, which tend to reflect changes in valuation after 18 to 24 months.
3. Increased Add-On Acquisitions and Earlier Write-Ups
Add-on activity continues to be a key driver of buyout activity as private equity firms see add-ons as a way to accelerate value creation and bring down overall purchase price multiples. Add-on acquisitions now comprise 80% of total U.S. buyout activity, compared to approximately 56% a decade ago[5]. These add-ons are typically purchased at a lower multiple than the platform investment, and successful integration and efficiencies results in earlier increased valuations.
The recent data shows that expectations of early performance for private equity funds should be adjusted, as it is no longer common for funds to have a negative IRR even in the initial years of the investment period. Thus, the j-curve has essentially been eliminated.
Importantly, the lack of a j-curve does not actually change the return profile of a private equity fund. Credit lines and earlier write-ups may show more positive interim marks, but performance is still predicated upon the ultimate realization of portfolio companies.
Investors should be diligent when benchmarking recent funds as it may not be an apples-to-apples comparison. Two funds with similar gross performance can have materially different net performance, depending on factors such as the terms of the firm’s credit line as well as their valuation policy. Canterbury typically considers the performance of funds raised within the prior three years as not yet meaningful.
This post has been prepared solely for informational purposes and not to be construed as an exhaustive explanation of private equity performance. It is not to be seen an offer to sell or recommend any specific private equity fund or strategy or to participate in any investment managed or associated with Canterbury. The general information related to duration and performance of private equity funds has been obtained from sources that Canterbury deemed reliable but the data has not been independently verified by Canterbury It should not be assumed that the strategies illustrated were or will be profitable or that past performance is illustrative of future returns. All investments entail risk. Investing in private equity entails the risk of loss and other known and unknown risks. forward looking statements do not, nor are they intended to, constitute a promise of actual results. Such information and forward-looking statements involve known and unknown risks, uncertainties and other important factors that could cause actual results to differ materially from the financial information, projections and estimates included in this presentation.
Sources