
In 2013, CNBC analyst Jim Cramer coined the term “FANG”, referring to Facebook, Amazon, Netflix, and Google. At the time, these stocks had positive business momentum, were dominant in their respective markets, and represented the future of consumer technology. Five record-shattering years later, it seems that not much has changed. Not only have the “FANG” stocks continued to gain momentum, they have picked up a few friends along the way. With the addition of technology giants Microsoft, NVIDIA, and Apple, some have called this new amalgam of stocks “FANGMAN."
Since 2014, these seven technology stocks have rapidly grown, as of June 30, 2018 representing 16.9% of the S&P 500 Index. One might think that the S&P 500 as a broadly diversified index, but that is only true for around 80% of it. The other 20% is a highly concentrated, mega-cap tech stock portfolio. Other times when a small group of stocks came to dominate the S&P 500 (think energy stocks back in the 1980s), things did not turn out so well for index investors.
Even for investors who favor a passive approach to investing, we recommend blending an allocation to the passive S&P 500 index with active managers or strategic beta (a passive-like approach that uses factors other than market cap to determine stock weightings) in order to diversify from some of this concentration risk.
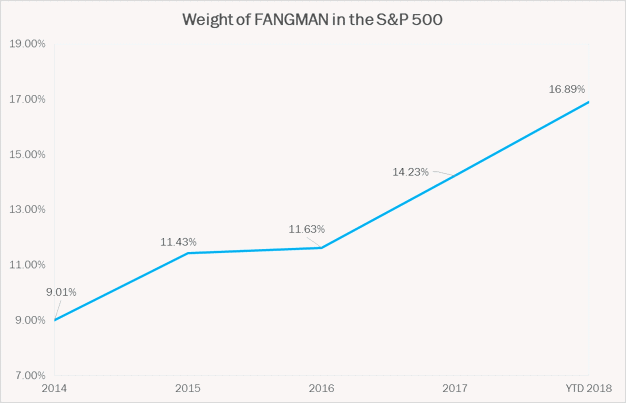
Exhibit A. Source: Bloomberg. As of 06/30/18.
Even a casual follower of the markets probably knows that the FANGMAN stocks have performed well over the past five years. But even Jim Cramer probably did not expect them to grow at an annual rate of roughly 41% as they have. Along the way, Apple became the first company to reach a market capitalization of $1 trillion on August 2, 2018, despite aggressively distributing billions of dollars to investors in the form of share buybacks and dividends.
In 2015, as well as the first half of 2018, the FANGMAN stocks were responsible for keeping the S&P 500’s annual positive performance streak (now at nine years and counting) alive. Over the last five years ending June 2018, these seven stocks have accounted for approximately half of the index’s gains. One can debate whether these returns are sustainable, but we all can agree that they are very strong.
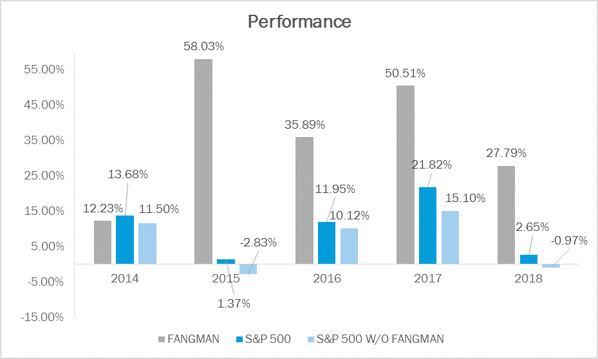
Exhibit B. Source: Bloomberg. As of 06/30/2018.
Although it has come down from its peak in 2015, the average 12-month trailing price-to-earnings ratio (P/E) of FANGMAN remains very high, at 69. This is more than twice as high as the S&P’s P/E ratio of 25, which itself is well above its historical average of 16.
Valuations for these stocks have been stretched since 2014, and could remain elevated. However, the high valuations on these companies could make them vulnerable in the event of a recession or market downturn. As investors turn their attention to stocks with higher margins of safety, the valuations on these growth-oriented stocks could plummet to levels more in-line with the S&P 500 average, sending share prices lower.
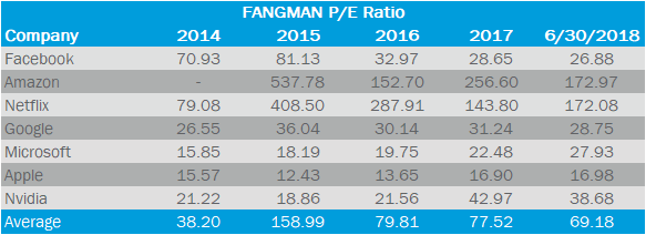
Exhibit C. Source: Bloomberg.
The purpose of this article is not to scare investors away from the FANGMAN stocks, but to caution against complacency in owning an index that is so heavily weighted towards large, high-growth, momentum technology stocks. We hope that FANGMAN’s incredible run continues on at the same pace indefinitely, as we are all shareholders in one form or another. But regardless of whether it does, we will continue to carefully select managers and strategies that will provide proper diversification in an unpredictable market.